
Amazon Affiliate Disclosure: As an Amazon Associate, Geronutrition earns from qualifying purchases. We recommend high-quality, evidence-based supplements and tools to support senior health based on clinical biomarker data.
Geriatric Blood Biomarker Analysis for Smarter Longevity Planning
Blood test results become more complex with age. A value marked “normal” on a standard laboratory report may still need closer attention when viewed alongside an older adult’s symptoms, medications, nutritional status, kidney function, inflammatory burden and previous results. This is why geriatric blood biomarker analysis should involve more than scanning a report for high and low flags.
The Blood Biomarker Analyzer 4.0 is designed to make blood test interpretation for seniors clearer and more structured. It organizes more than 40 nutritional, metabolic, inflammatory and longevity-related biomarkers into clinically relevant categories, helping users examine how individual results may connect with broader patterns. These markers include vitamin B12, folate, vitamin D, ferritin, magnesium, albumin, hs-CRP, homocysteine, methylmalonic acid and the Omega-3 Index.
A conventional laboratory report remains the essential starting point. It shows the measured value, unit and laboratory-specific reference interval used to identify potentially abnormal findings. However, it may not explain how several borderline markers interact, whether a result has changed significantly over time or how aging-related factors could affect its meaning. This creates an important distinction when comparing a blood biomarker analyzer vs. standard lab reports: the lab report supplies the validated test data, while the analyzer adds an educational layer for pattern recognition and longevity-focused review.
For seniors, family caregivers and health-conscious adults, the challenge is not simply learning how to read geriatric blood work. The greater challenge is understanding which findings deserve discussion, which related markers should be considered together and whether an apparently acceptable number is moving in an unfavorable direction. A vitamin B12 result, for example, may need to be interpreted alongside methylmalonic acid and homocysteine. Albumin may contribute information about protein and nutritional status, but it can also be affected by inflammation, liver disease, kidney disease and acute illness. No single value should be treated as a complete explanation of health.
The analyzer supports longevity biomarker tracking by shifting attention from isolated numbers toward trends, relationships and clinical context. Rather than declaring that one universal “optimal” range applies to everyone, it helps users examine how age, health history, medications and repeated measurements may change the significance of a result. This is particularly valuable when reviewing nutrient deficiencies, low-grade inflammation, hydration and electrolyte patterns, protein status and other factors associated with healthy aging.
Blood Biomarker Analyzer 4.0 does not diagnose disease, prescribe treatment or replace professional medical care. Its purpose is to translate complex laboratory data into a more understandable framework so users can prepare better questions, identify areas requiring further evaluation and discuss their results more productively with a qualified clinician. Used responsibly, it turns a static set of laboratory values into a more connected view of nutritional resilience, functional health and long-term aging trends.
Quick Jump
- Blood Biomarker Analyzer 4.0
- Clinical Purpose of the Analyzer
- Who Should Use This Tool?
- The Science of Optimal vs. Normal Ranges
- Longevity Trends & AI Integration
- Comparison: Analyzer 4.0 vs. Standard Reports
- Safety, Risks & Accuracy
What is the Blood Biomarker Analyzer 4.0?
The Blood Biomarker Analyzer 4.0 is a sophisticated digital diagnostic layer designed to sit atop raw laboratory data. Standard blood tests often provide “reference ranges” based on the average population—which includes individuals who are already ill. Our analyzer focuses specifically on Geriatric Blood Biomarker Analysis, shifting the focus from “not sick” to “biologically thriving.”
This tool processes over 40 distinct markers—ranging from core vitamins like B12 and D3 to advanced longevity indicators like Homocysteine and the Omega-3 Index—to provide a comprehensive snapshot of biological age and nutritional resilience.
Explore our Tools & Clinical Resources Hub for more interactive senior health calculators.
Why Senior Longevity Mapping is the New Standard
Traditional healthcare often reacts to disease once it manifests. In contrast, modern gerontology utilizes Blood Test Interpretation for Seniors to identify sub-clinical trends. For instance, an Albumin level of 3.6 might be marked “Normal” by a lab, but for a 70-year-old, it signals a high risk for sarcopenia and protein malnutrition. Analyzer 4.0 bridges this gap by providing context-specific insights.
👉 Access the Free Blood Biomarker Analyzer 4.0 Now
Who Needs This Clinical Resource?
This tool is engineered for a multi-disciplinary audience seeking more than just a list of numbers:
- Proactive Seniors: Individuals aiming to extend their healthspan and optimize physical performance.
- Family Caregivers: Those managing the complex medical profiles of aging parents who need a clearer understanding of “gray-area” results.
- Integrative Practitioners: Clinicians looking for a rapid screening tool to identify nutrient gaps or chronic “inflamm-aging” patterns.
Core Benefits of Precision Analysis
- Nutrient Gap Identification: Pinpoint exactly where Vitamin B, D, or trace minerals are falling below “optimal” levels. Utilize our tools on vitamin deficiency symptom checker to address suboptimal vitamin markers.
- Inflamm-aging Detection: Early identification of low-grade systemic inflammation via hs-CRP and ESR. Learn more about Inflammaging prevention to lower your CRP levels.
- Personalized Supplementation: Instead of guesswork, base your regimen on the best supplements for longevity or specific micronutrients.
- Cost Efficiency: This tool is Free, saving hundreds in private consultation fees for initial data screening.
Blood Biomarker Analyzer 4.0: Precision Longevity Mapping for Seniors
GERONUTRITION
geronutrition.comV4.0 | Advanced Geriatric Biomarker Interpretation for Longevity Planning.
Standard Lab Range vs. Longevity Optimal Range
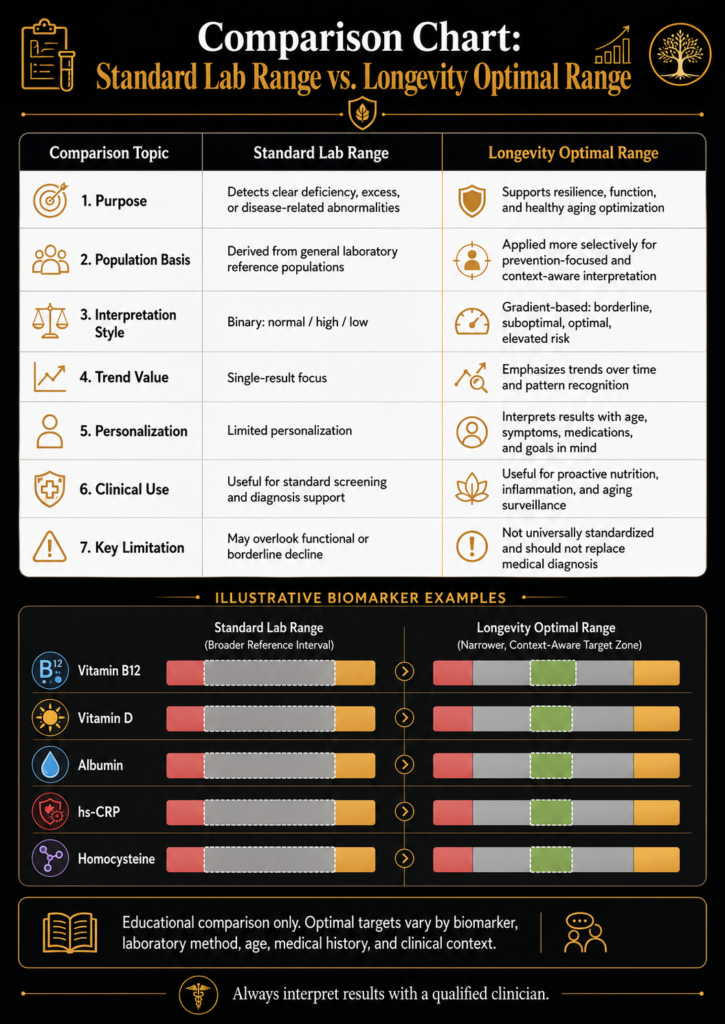
A blood test result can be technically “normal” without necessarily representing the most favorable position for long-term health. This distinction sits at the center of the debate over standard lab ranges vs. longevity optimal ranges.
A standard laboratory report asks a clinically essential question: Does this result fall within the laboratory’s established reference interval? A longevity-focused interpretation asks a different question: How does this result relate to function, resilience, nutritional status and change over time?
These approaches are not competitors. The first provides a standardized clinical foundation; the second may add a more preventive and individualized layer of interpretation.
What Is a Standard Laboratory Reference Range?
A standard lab range, more accurately called a reference interval, identifies the lower and upper values expected for a particular test within an appropriate reference population. Laboratories may establish different ranges according to the testing method and the population being assessed. Separate intervals may also be used according to factors such as age or sex.
A result inside this interval is generally reported as being within range. A result outside it may be flagged as high or low. That flag can help clinicians identify possible deficiencies, metabolic disturbances, organ dysfunction or other abnormalities requiring further evaluation.
However, a reference range is not a diagnostic verdict. A value outside the interval does not automatically prove disease, and a value inside it does not guarantee that every aspect of health is optimal. Diet, hydration, medications, recent illness, physical activity and preparation for the test can all affect laboratory findings.
It is also inaccurate to describe standard laboratory ranges as simple averages derived from people who are already ill. Reference intervals are generally developed using results from selected reference populations, often consisting of people considered healthy under the laboratory’s inclusion criteria. Their main limitation is not that they are based on sick populations, but that they are designed for broad clinical interpretation rather than individualized longevity planning.
What Is a Longevity Optimal Range?
A longevity optimal range is usually a narrower, prevention-oriented target zone proposed for a specific biomarker. Instead of asking only whether a result is abnormal, this approach considers whether the value appears favorable for maintaining metabolic stability, physical function, cognitive health, nutritional resilience or healthy aging.
Longevity interpretation frequently places more emphasis on:
- Movement in a biomarker across repeated tests
- Relationships among multiple biomarkers
- Age, symptoms and medical history
- Medication and supplement use
- Nutritional intake and absorption
- Physical function, frailty and disease risk
- The clinical significance of borderline results
The central idea is valuable: biological risk often develops gradually rather than appearing at the precise moment a laboratory value crosses a reference boundary. A marker may move steadily toward the edge of its range over several years while remaining technically unflagged.
Nevertheless, the term optimal range requires caution. Unlike conventional laboratory reference intervals or guideline-based treatment thresholds, many longevity targets are not universally standardized. Different clinicians, researchers and commercial platforms may define “optimal” differently. Research into biological-age and longevity biomarkers is advancing, but there is still no consensus on how many emerging aging biomarkers should be validated before routine clinical use.
Standard Lab Range vs. Optimal Range at a Glance
| Interpretation factor | Standard lab range | Longevity optimal range |
|---|---|---|
| Primary purpose | Identify values inside or outside an established reference interval | Explore whether values appear favorable for long-term function and resilience |
| Range structure | Usually a broader laboratory-specific interval | Often a narrower proposed target zone |
| Reporting style | Normal, high or low | Low, borderline, suboptimal, favorable or elevated risk |
| Main emphasis | Current clinical abnormality | Prevention, trajectory and early pattern recognition |
| Personalization | Limited within the printed report | Greater attention to age, symptoms, history and goals |
| Trend analysis | May display previous values but often centers on the current test | Emphasizes direction, rate of change and repeated measurements |
| Standardization | Established through laboratory methods and clinical practice | Varies considerably by biomarker and interpretive model |
| Appropriate role | Foundation for clinical interpretation | Supplementary context, not a replacement for diagnosis |
Why the Difference Matters More in Older Adults
Geriatric blood test interpretation is rarely as simple as labeling each result normal or abnormal. Older adults are more likely to have multiple chronic conditions, use several medications and experience changes in hydration, kidney function, nutrient absorption, muscle mass and inflammatory status. These factors can alter both the biomarker itself and its clinical meaning.
Albumin demonstrates the problem clearly. A lower albumin result can be associated with nutritional vulnerability, but it may also reflect liver disease, kidney disease, inflammation or another medical condition. Albumin should therefore be interpreted as part of a larger clinical pattern rather than used alone to diagnose malnutrition or muscle loss.
Vitamin D provides another example. The accepted measure of vitamin D status is serum 25-hydroxyvitamin D, but discussions about a single “perfect” level can obscure the difference between evidence-based adequacy thresholds and higher targets promoted for optimization. The NIH Office of Dietary Supplements reports that a level of at least 20 ng/mL, or 50 nmol/L, is sufficient for most people, while deficiency risk increases below 12 ng/mL, or 30 nmol/L. Higher concentrations should not automatically be interpreted as healthier.
The same principle applies across geriatric biomarkers: an apparently favorable number only has value when its definition is supported by evidence and interpreted in the correct clinical context.
Trends Often Matter More Than a Single “Optimal” Number
One of the strongest contributions of longevity biomarker tracking is its emphasis on direction rather than isolated values.
Consider two older adults with the same current result. One has remained stable for five years. The other has moved progressively toward the edge of the laboratory range during each annual test. The numbers may look identical on the latest report, but their trajectories tell different stories.
Longitudinal analysis may help reveal:
- Gradual nutrient depletion
- Worsening glucose regulation
- Persistent low-grade inflammation
- Declining protein or iron status
- Medication-related electrolyte changes
- Improvement following dietary or clinical intervention
For the comparison to be meaningful, results should ideally be obtained under similar testing conditions and, where practical, through the same laboratory. Reference intervals and measurement methods can differ, making direct comparison between laboratories unreliable.
The Safest Way to Use Longevity Optimal Ranges
A longevity target should function as a clinical conversation prompt, not an automatic treatment instruction.
When a biomarker falls outside a proposed optimal zone but remains within the standard laboratory range, the next step is not necessarily supplementation or medication. The appropriate response may be to confirm the result, review related markers, examine the trend, assess symptoms or discuss whether additional testing is justified.
Equally, a result that falls inside a longevity optimal range should not overrule symptoms, medical history or abnormal findings elsewhere in the panel. No single blood marker can fully measure biological aging, and current research increasingly recognizes that aging must be evaluated across multiple physiological systems.
The most responsible interpretation therefore uses three layers:
The laboratory reference range establishes the validated reporting framework.
Clinical thresholds and professional guidelines identify when investigation or treatment may be appropriate.
Longevity-oriented analysis adds context through trends, relationships among biomarkers and individualized health goals.
Used together, these layers can turn a static laboratory report into a more informative view of senior health. Used carelessly, an unsupported “optimal” range can create unnecessary concern, encourage excessive supplementation or provide false reassurance.
The objective is not to replace standard laboratory medicine with longevity language. It is to interpret blood work more intelligently—recognizing the difference between being within a reference interval and building a clinically grounded picture of long-term function, resilience and healthy aging.
Comparison: Blood Biomarker Analyzer vs Traditional Lab Reports
| Feature | Standard Lab Report | Blood Biomarker Analyzer 4.0 |
| Reference Range | Broad population average | Geriatric-specific optimal zones |
| Logic Type | Binary (High/Low) | Multi-variate (Functional trends) |
| Cognitive Markers | Rarely connected | Links B12, MMA, & Homocysteine |
| Inflammation | Focus on acute infection | Focus on chronic “Inflamm-aging” |
| Cost | Part of lab fee | Free Clinical Resource |
Trends, Latest Tech and AI Integration
The field of Longevity Biomarker Tracking is moving toward real-time biological age clocks (e.g., Horvath’s Clock). Analyzer 4.0 integrates the latest geriatric nutrition algorithms to calculate a “Longevity Resilience Score.”
Upcoming Models & AI Evolution
Version 5.0 (currently in development) will feature:
- Predictive Sarcopenia Modeling: Using Albumin and BUN/Creatinine ratios to predict muscle loss trajectory.
- Machine Learning Personalization: AI that learns from your previous 5 tests to show rate-of-decay or improvement.
- Direct Specialist Sync: Securely pushing your data to an Online Geriatrician for instant intervention.
Risks, Accuracy, and Clinical Governance
While the Blood Biomarker Analyzer 4.0 uses evidence-based ranges, it is not a replacement for a medical diagnosis.
- The “Snapshot” Risk: Blood markers can fluctuate based on hydration, stress, and temporary illness.
- Integration Necessity: Always view these results alongside a physical exam.
- Privacy: We recommend using the tool to generate a report, then discussing it via a secure Online Consultation to ensure clinical safety.
Geriatric Blood Test Interpretation Flow Chart
Raw blood test result
        ↓
Confirm units and laboratory reference range
        ↓
Compare with previous results from the same laboratory
        ↓
Review age, medications, hydration and recent illness
        ↓
Examine related biomarkers rather than one isolated value
        ↓
Connect results with symptoms and medical history
        ↓
Discuss significant findings with a qualified clinician
Laboratory values should be interpreted against the reference range printed on the original report. Results from different laboratories may not be directly comparable because testing methods and reference intervals can differ.
Frequently Asked Questions
What Is Geriatric Blood Biomarker Analysis?
Geriatric blood biomarker analysis is the interpretation of laboratory results within the health context of an older adult. It considers laboratory-specific reference ranges, previous results, medications, kidney function, nutritional status, inflammation and current symptoms. It can reveal patterns that an isolated high-or-low flag may miss, but it does not independently diagnose disease.
How Does a Blood Biomarker Analyzer Work for Seniors?
A blood biomarker analyzer for seniors organizes entered laboratory values, compares them with defined ranges and looks for related patterns across nutrient, protein, inflammation, electrolyte and longevity markers. The Blood Biomarker Analyzer 4.0 described in the article evaluates more than 40 markers, including vitamin B12, vitamin D, albumin, CRP, homocysteine and MMA.
Its output should be treated as an interpretive screening report rather than a medical diagnosis.
Which Blood Tests Are Most Important for Seniors?
There is no universal senior blood test panel for every older adult. Frequently reviewed areas include blood-cell counts, glucose control, kidney and liver function, electrolytes, lipids, thyroid function and selected nutrient markers. Vitamin B12, vitamin D, ferritin, iron studies or inflammation markers may be added when symptoms, medications, diet or medical history indicate a need.
What Is the Difference Between Normal Lab Ranges and Optimal Biomarker Ranges?
A normal laboratory range is a reference interval established by a laboratory using results from an appropriate reference population. An optimal biomarker range is usually a narrower target proposed for a particular clinical, preventive or performance objective.
Optimal ranges are not universally standardized. They should never replace the laboratory’s stated range, validated clinical thresholds, symptoms, diagnosis or professional interpretation.
Can a Blood Biomarker Analyzer Diagnose Disease?
No. A blood biomarker analyzer can identify patterns, organize results and highlight values that may deserve attention, but it cannot confirm a diagnosis by itself. Diagnosis may require a physical examination, medical history, repeat blood work, imaging or additional testing.
FDA guidance distinguishes decision-support software from tools intended to make diagnostic or treatment decisions, particularly when patients cannot independently review the basis of the recommendation.
How Often Should Seniors Track Longevity Biomarkers?
The appropriate frequency for longevity biomarker tracking in seniors depends on medical conditions, medications, previous abnormalities and treatment changes. Stable results may be reviewed during routine medical care, while a deficiency, medication adjustment or abnormal result may require earlier retesting.
For meaningful trend analysis, use the same laboratory when practical because methods and reference ranges can differ between laboratories.
Why Are Vitamin B12, MMA and Homocysteine Checked Together?
A serum vitamin B12 blood test is usually the starting measurement, but borderline results may not show whether tissues are receiving enough functional B12. Methylmalonic acid, or MMA, is a sensitive marker that can help confirm deficiency.
Homocysteine may also increase as B12 status declines, but it is less specific because folate status and kidney function can affect it. MMA can also rise with reduced kidney function and advancing age.
What Do CRP and hs-CRP Show in Older Adults?
A CRP blood test measures inflammation but does not reveal its exact cause or location. Elevated CRP can occur with infection, autoimmune disease, chronic inflammatory conditions, smoking and other health factors.
The hs-CRP test measures much smaller CRP elevations and is primarily used as part of cardiovascular risk assessment. CRP and hs-CRP are related tests, but they are not interchangeable.
Can Low Albumin Indicate Malnutrition or Sarcopenia?
Low serum albumin in older adults can occur with inadequate nutrition, but it may also reflect inflammation, infection, liver disease, kidney disease or impaired nutrient absorption. Albumin is therefore a contextual marker rather than a stand-alone diagnosis of malnutrition.
Lower albumin has been associated with sarcopenia and frailty in older populations, but muscle strength, physical performance, body composition and dietary assessment are still needed.
Is an AI Blood Test Analyzer Accurate and Private?
An AI blood test analyzer is only as reliable as its input data, reference intervals, clinical rules, validation process and ability to explain its reasoning. Incorrect units, incomplete medical history or data-entry mistakes can produce misleading interpretations.
Privacy depends on how the tool stores, transmits and deletes health information. Users should review its privacy policy and avoid assuming that every online analyzer meets medical-device or healthcare-data security standards.
People Also Ask
How Do You Read Geriatric Blood Work Correctly?
To read geriatric blood work, first confirm the units and reference range printed on the report. Then compare the value with previous tests, preferably from the same laboratory. Consider medications, supplements, hydration, recent infection, fasting status, kidney function and symptoms.
An isolated abnormal result may be temporary, while a result inside the range may still need investigation when symptoms or a concerning trend are present.
What Blood Test Shows Biological Age?
No single routine blood test shows biological age with established clinical certainty. Researchers are studying combinations of proteins, inflammatory markers, metabolic measures, epigenetic changes and other biomarkers to estimate how rapidly a person may be aging.
These biological-age models remain an evolving research field and should not be treated as a definitive prediction of lifespan or future disease.
What Are the Best Blood Biomarkers for Longevity?
There is no universally accepted list of the best blood biomarkers for longevity. A practical longevity panel may examine cardiometabolic health, glucose regulation, kidney and liver function, blood-cell status, inflammation and nutritional sufficiency.
The most useful biomarkers are those connected to a person’s medical risks and tracked consistently over time. Biomarkers should support preventive care rather than promise an exact biological age or lifespan.
What Blood Tests Detect Vitamin Deficiency in Older Adults?
Common vitamin deficiency blood tests for older adults include serum 25-hydroxyvitamin D, serum vitamin B12, methylmalonic acid and folate. Ferritin, serum iron, transferrin and total iron-binding capacity evaluate iron status rather than vitamin status.
The correct tests depend on symptoms, dietary intake, medications, absorption disorders, kidney function and previous results.
What Is a Good Vitamin D Level for Seniors?
The main vitamin D blood test for seniors is serum 25-hydroxyvitamin D, written as 25(OH)D. The National Academies considers 20 ng/mL, or 50 nmol/L, sufficient for most people, while deficiency risk increases below 12 ng/mL, or 30 nmol/L.
Assay variation, bone health, kidney disease and individual clinical factors can affect interpretation, so higher is not automatically better.
What Causes High Homocysteine in Older Adults?
High homocysteine in older adults may be associated with low vitamin B12 or folate, but it can also be influenced by declining kidney function and other medical factors. Homocysteine is therefore not specific enough to diagnose a nutrient deficiency alone.
A clinician may interpret it alongside vitamin B12, MMA, folate, creatinine, medication use and dietary history.
What Does a High CRP Blood Test Mean in Seniors?
A high CRP blood test in seniors indicates that inflammation is present, but it does not identify the source. Possible explanations include infection, autoimmune disease, inflammatory disorders, smoking, obesity or another acute or chronic condition.
CRP should be evaluated with symptoms, medical history and other laboratory findings. A separate hs-CRP test may be used when cardiovascular risk is the primary concern.
Is Albumin a Reliable Marker of Nutritional Status in Elderly Patients?
Albumin can contribute to an elderly nutrition assessment, but it is not reliable as the only marker. Low albumin may result from malnutrition, inflammation, infection, liver dysfunction, kidney disease or gastrointestinal malabsorption.
A stronger assessment combines albumin with weight change, food intake, muscle strength, physical performance, medical history and other laboratory findings.
Can Blood Tests Predict Sarcopenia or Frailty?
Blood tests may identify patterns associated with sarcopenia and frailty, including lower albumin or hemoglobin and higher inflammatory markers. However, no routine blood marker independently confirms sarcopenia.
Diagnosis and risk assessment generally require physical measures such as grip strength, walking performance, chair-rise ability and muscle-mass evaluation alongside nutrition and medical assessment.
What Is the Difference Between a Blood Biomarker Analyzer and a Standard Lab Report?
A standard laboratory report presents measured values, units, reference intervals and abnormal-result flags. A blood biomarker analyzer adds an interpretive layer that may organize related markers, compare trends and explain possible patterns.
The analyzer may improve readability, but it does not make the original laboratory report less important. Safe interpretation still requires laboratory-specific ranges, transparent logic and professional review of medically significant findings.
Geriatric Biomarker Interpretation Table
| Biomarker Group | Examples | What It May Help Assess | Important Limitation |
|---|---|---|---|
| Vitamins | B12, folate, 25(OH)D | Nutrient status and possible deficiency | Cutoffs and assay methods can vary |
| Functional B12 markers | MMA, homocysteine | Clarifying borderline B12 results | Kidney function can affect both |
| Protein status | Albumin, total protein | Nutrition, liver, kidney and inflammatory context | Albumin is not a stand-alone nutrition diagnosis |
| Inflammation | CRP, hs-CRP, ESR | Acute or chronic inflammatory activity | Does not identify the cause by itself |
| Iron status | Ferritin, iron, transferrin, TIBC | Iron stores and iron availability | Ferritin can rise during inflammation |
| Electrolytes | Sodium, potassium, chloride | Hydration, kidney and medication effects | Acute illness can temporarily alter values |
| Longevity research | Biomarker panels and biological-age models | Longitudinal health-pattern research | Not validated to predict an individual lifespan |
| AI interpretation | Pattern recognition and trend summaries | Making complex lab reports easier to review | Accuracy depends on data quality and validation |
Clinical safety note: This FAQ and PAA content is educational. Blood test results should be interpreted by a qualified healthcare professional who can consider symptoms, diagnoses, medications, examination findings and the original laboratory report.