
Amazon Affiliate Disclosure: Geronutrition may earn a commission from qualifying purchases made through affiliate links. This does not affect the price paid by the individual or the editorial independence of our content.
Medical Information Notice: This guide is intended for general education. A biomarker result should be interpreted by a qualified healthcare professional who understands the individual’s medical history, medications, symptoms, physical function and laboratory methodology. Reference intervals and treatment targets may differ between laboratories and clinical situations.
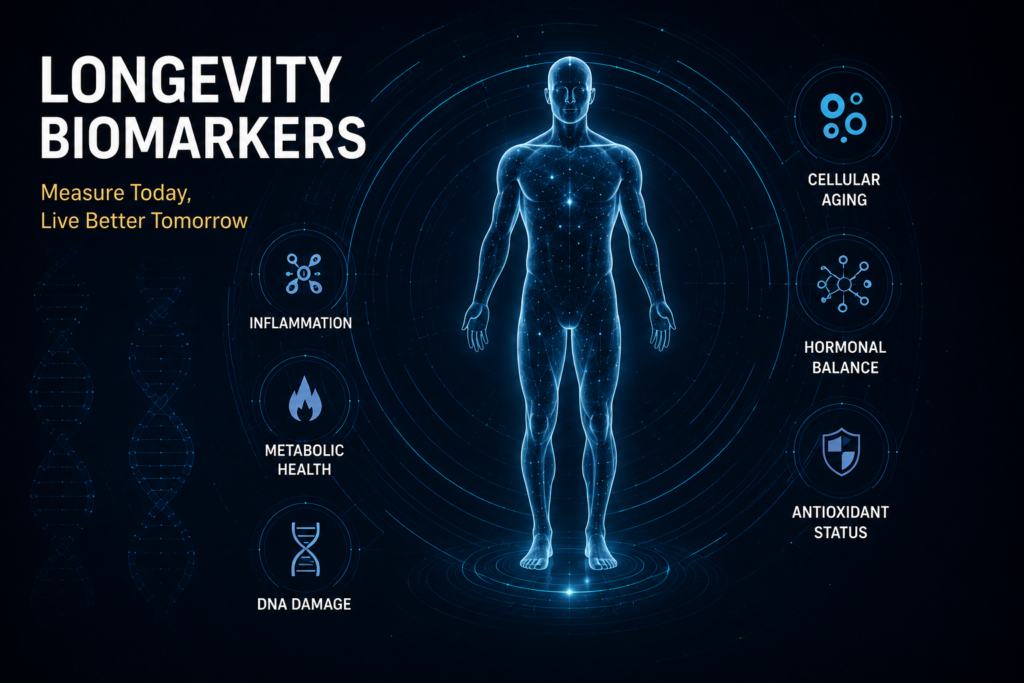
Longevity biomarkers are measurable signals that reveal how well the body is maintaining metabolic control, nutritional status, inflammatory balance, organ function, muscle capacity and physiological resilience over time.
They do not reveal the date a person will die. They do something more practical: they show where biological strain may be accumulating before that strain becomes obvious through symptoms, disability or a diagnosed age-related condition.
A person can appear outwardly healthy while HbA1c is slowly rising, grip strength is declining, albumin is trending downward or chronic inflammation is becoming more persistent. None of these measurements tells the complete story. Together, however, they can reveal whether the body is preserving healthspan or gradually losing its ability to adapt.
This is why the strongest longevity assessment is not built around a single fashionable test. It combines routine blood markers, nutritional indicators, metabolic measurements, functional performance and carefully selected biological age tools. Current aging research similarly emphasizes composite and multisystem approaches because no single measurement is sufficiently specific or sensitive to represent the entire aging process.
Within Geronutrition’s broader Deficiency Biomarker Optimization center, this guide explains which longevity biomarkers deserve attention, what each marker is actually measuring, who may benefit from testing and how to distinguish an actionable health signal from an interesting but experimental number.
Quick Jump
- What are longevity biomarkers and what are they for?
- Who needs longevity biomarker testing?
- Benefits of tracking longevity biomarkers
- Biomarkers of aging and the systems they measure
- The longevity biomarker interpretation framework
- Vitamin D levels after 60
- Homocysteine and aging
- CRP and chronic inflammation
- Albumin levels and malnutrition
- HbA1c and aging metabolism
- Muscle mass aging biomarkers
- Biological age vs chronological age
- What blood tests predict longevity?
- How to interpret longevity blood markers
- How often should biomarkers be tested?
- Longevity biomarker comparison chart
- Common testing mistakes
- Upcoming trends and latest longevity research
- Editorial insights
- Longevity biomarker FAQs
- People Also Ask
What Are Longevity Biomarkers and What Are They For?
A longevity biomarker is an objectively measurable characteristic associated with aging, age-related disease risk, functional decline, resilience or survival.
Some longevity biomarkers are familiar laboratory measurements:
- HbA1c
- Fasting glucose
- Albumin
- Creatinine
- Cystatin C
- High-sensitivity C-reactive protein
- Homocysteine
- Vitamin D
- Apolipoprotein B
- Lipoprotein(a)
- Red blood cell distribution width
Others are physical or functional measurements:
- Handgrip strength
- Walking speed
- Chair-rise performance
- Appendicular lean mass
- Waist-to-height ratio
- Cardiorespiratory fitness
- Resting heart rate
- Blood pressure
A third group uses molecular or computational methods:
- DNA methylation age
- Phenotypic age
- Proteomic age
- Glycomic age
- Immune age
- Organ-specific biological age
- Multi-omics aging scores
The word “biomarker” can make all these measurements sound equally established. They are not. HbA1c, blood pressure and kidney function markers already influence routine medical decisions. Epigenetic clocks and organ-age models may provide valuable research information, but their role in everyday clinical care is still developing.
What Longevity Biomarkers Are For
Longevity biomarkers can serve several distinct purposes.
Early risk detection: A marker may identify a developing problem before symptoms are obvious. Rising HbA1c, for example, may reveal deteriorating glucose regulation long before a person experiences classic symptoms of diabetes.
Nutritional assessment: Vitamin, mineral, protein and hematologic markers can reveal dietary insufficiency, impaired absorption, medication interactions or disease-related depletion.
Organ-function monitoring: Kidney, liver, cardiovascular and hematologic markers show whether major physiological systems are maintaining reserve.
Functional aging assessment: Muscle strength, gait speed and chair-rise performance reveal whether a person can translate biological resources into real physical capacity.
Intervention tracking: Repeat testing may help determine whether changes in diet, physical activity, body composition, sleep, medication or supplementation are producing a meaningful response.
Biological age estimation: Composite algorithms can compare a person’s biomarker pattern with population patterns associated with different ages or health outcomes.
What Longevity Biomarkers Cannot Do
A biomarker cannot guarantee lifespan, prove that a supplement extends life or turn a statistical association into a personal destiny.
A low hs-CRP result does not erase cardiovascular risk from smoking, hypertension or elevated ApoB. A favorable biological age score does not rule out cancer. A high epigenetic age does not prove that irreversible aging has occurred.
Biological age estimates can predict certain health outcomes at a population level, but demographic conditions, socioeconomic circumstances, mental health, health behaviors and functional status can be equally strong or stronger predictors of late-life outcomes.
The proper question is therefore not, “Which number tells me how long I will live?”
It is, “Which combination of measurements reveals where my health is stable, where it is changing and where an intervention may be justified?”
Who Needs Longevity Biomarker Testing?

Not every healthy person needs an extensive private laboratory panel, monthly blood draws or an expensive biological age test. The usefulness of testing depends on age, symptoms, medical history, family history, medications, nutrition and whether the result will alter a decision.
Adults Over 60
Adults over 60 may benefit from a more integrated view of metabolic health, muscle preservation, nutrient status, kidney function and inflammation.
The goal is not to label normal aging as disease. It is to detect changes that may otherwise be dismissed as inevitable.
Fatigue, weakness, slower walking, reduced appetite, unexplained weight loss and declining activity can reflect very different underlying processes. A biomarker-guided assessment may help distinguish between anemia, vitamin deficiency, inflammation, impaired glucose regulation, renal dysfunction, protein-energy malnutrition and sarcopenia.
Individuals With Unexplained Fatigue or Reduced Physical Capacity
Fatigue has a broad differential diagnosis. Potential contributors include iron deficiency, vitamin B12 deficiency, folate deficiency, thyroid dysfunction, anemia, chronic inflammation, impaired kidney function, sleep disorders, inadequate energy intake and medication effects.
A broad assessment is usually more informative than selecting a single fashionable longevity marker.
Individuals Experiencing Muscle Loss or Weakness
A person who has difficulty rising from a chair, carrying groceries, climbing stairs or recovering after illness may need more than a body-weight measurement.
Strength, muscle quantity, dietary protein, vitamin D status, inflammation, kidney function and total energy intake may all be relevant. Functional decline can occur even when body weight remains stable because fat mass may replace lost lean tissue.
People With Prediabetes, Diabetes or Abdominal Adiposity
HbA1c, fasting glucose, triglycerides, waist circumference, blood pressure and liver markers can reveal the metabolic environment in which aging is occurring.
The same chronological age can produce very different health trajectories depending on whether glucose remains stable, vascular risk is controlled and skeletal muscle continues to absorb and use glucose efficiently.
People Following Restrictive Diets
Vegan diets, low-carbohydrate diets, weight-loss programs, elimination diets, fasting regimens and medically restricted diets can all be structured safely. They can also create blind spots when food variety, protein intake or micronutrient density becomes too limited.
Testing may be especially relevant when dietary restriction is accompanied by fatigue, hair loss, reduced appetite, muscle weakness, cognitive changes or unexplained weight change.
A broader guide to common vitamin deficiencies can help distinguish between symptoms that justify laboratory investigation and nonspecific symptoms that require a wider clinical assessment.
Individuals Taking Multiple Medications
Metformin, proton pump inhibitors, diuretics, corticosteroids, anticonvulsants and several other medication classes can alter nutrient status, glucose regulation, electrolyte balance, bone health or renal monitoring requirements.
A longevity panel should never be interpreted without reviewing medication use. A laboratory change may reflect the medication, the condition being treated, an interaction or a genuine age-related shift.
People With Strong Family Histories
Family histories of premature cardiovascular disease, type 2 diabetes, osteoporosis, dementia or kidney disease can justify earlier or more specific assessment.
For example, lipoprotein(a) is largely genetically determined and may add information when premature cardiovascular disease appears in a family despite otherwise unremarkable conventional risk factors.
People Recovering From Illness, Surgery or Hospitalization
Acute illness can accelerate muscle loss, suppress appetite, raise inflammatory markers and temporarily distort blood results.
Testing during recovery may be useful, but timing matters. A value measured during acute inflammation may not represent the person’s stable baseline. Repeat testing after recovery can help separate temporary physiological stress from persistent decline.
Benefits of Tracking Longevity Biomarkers
The value of longevity testing does not come from collecting the largest possible number of measurements. It comes from choosing markers that answer a defined question.
It Converts Vague Risk Into a Measurable Pattern
“Aging well” is an imprecise goal. A biomarker framework turns that goal into observable domains:
- Is glucose regulation stable?
- Is inflammation persistent?
- Is kidney function changing?
- Is protein status deteriorating?
- Is muscle strength being preserved?
- Are nutrient deficiencies contributing to fatigue or weakness?
- Is cardiovascular risk improving or worsening?
These questions are more actionable than a generalized desire to “slow aging.”
It Makes Trends Visible
One result is a photograph. A sequence of standardized results is a film.
A high-normal HbA1c that has remained stable for ten years may carry a different interpretation from an HbA1c that has moved upward at every annual test. The same principle applies to albumin, estimated glomerular filtration rate, grip strength, waist circumference and inflammatory markers.
The direction, speed and persistence of change often matter more than a single isolated position inside a laboratory reference interval.
It Helps Prioritize Interventions
A person may be taking multiple supplements while the major health constraint is low muscle strength, uncontrolled blood pressure or worsening glycemia.
Biomarker tracking can redirect attention from low-impact optimization toward high-impact fundamentals.
A useful hierarchy is:
- Identify disease requiring medical care.
- Correct clinically meaningful deficiencies.
- Control major cardiometabolic risk factors.
- Preserve muscle, balance and aerobic capacity.
- Improve sleep, diet quality and recovery.
- Consider advanced aging measurements only when they add information.
It Can Prevent Inappropriate Supplementation
Symptoms such as fatigue, muscle discomfort and low mood are often attributed to vitamin deficiency without testing or clinical assessment.
Biomarkers can confirm whether a deficiency is likely, reveal whether a suspected deficiency is absent and prevent prolonged high-dose supplementation that may create toxicity or mask another condition.
It Creates a Shared Language With Healthcare Professionals
A well-organized record of dates, results, symptoms, interventions and medication changes can improve clinical conversations.
Instead of saying, “I feel older,” the person can report:
- Grip strength has declined over 18 months.
- HbA1c increased despite stable weight.
- Albumin fell after a prolonged illness.
- Homocysteine remained elevated after folate normalized.
- Walking speed has not returned to baseline.
Specific patterns are easier to investigate than generalized concerns.
Biomarkers of Aging: The Systems That Matter
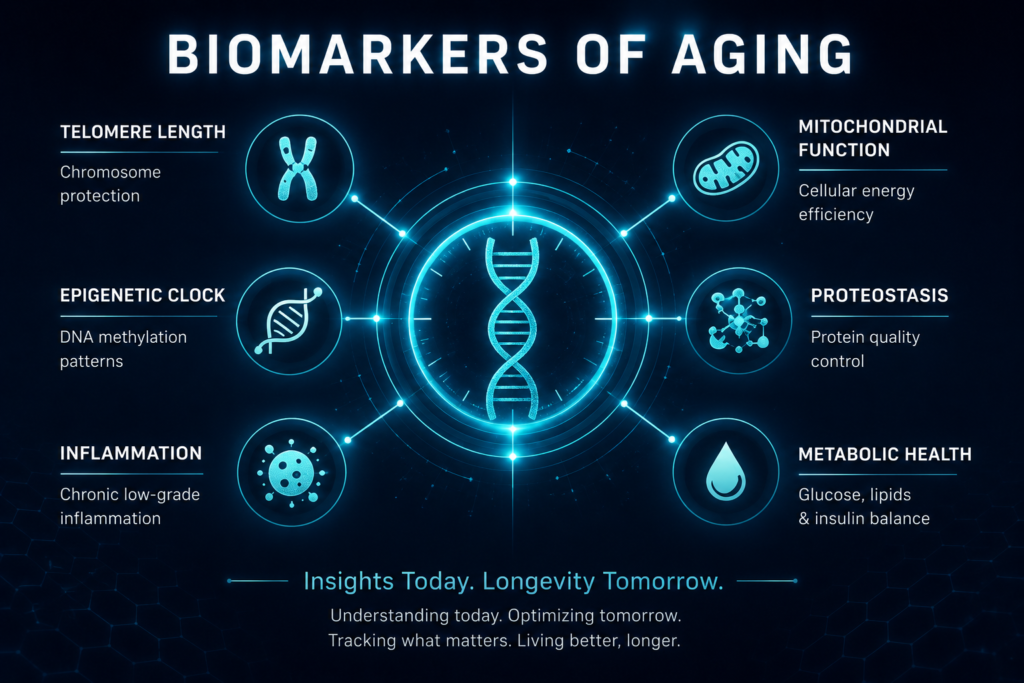
Aging does not occur in one organ or one biochemical pathway. It develops through interacting changes in metabolism, inflammation, vascular function, immune regulation, muscle, nutrition, repair and resilience.
This is why a useful longevity assessment is organized by physiological system rather than by whichever tests happen to be fashionable.
| Physiological Domain | Representative Biomarkers | What They May Reveal | Major Limitation |
|---|---|---|---|
| Nutrient status | Vitamin D, B12, folate, ferritin, transferrin saturation, magnesium | Intake, absorption, storage and nutrient-related dysfunction | Blood concentration may not always reflect tissue status |
| Metabolic control | HbA1c, fasting glucose, triglycerides, insulin where appropriate | Glycemic exposure, insulin resistance and metabolic flexibility | Illness, anemia and medications can alter interpretation |
| Inflammation | hs-CRP, standard CRP, white blood cell count, selected cytokines | Acute or chronic inflammatory activity | Usually nonspecific |
| Cardiovascular risk | Blood pressure, ApoB, LDL-C, non-HDL-C, Lp(a), triglycerides | Atherogenic burden and vascular risk | Must be integrated with age, smoking and medical history |
| Kidney function | Creatinine, eGFR, cystatin C, urine albumin-to-creatinine ratio | Filtration, renal reserve and vascular injury | Creatinine is influenced by muscle mass |
| Liver and metabolic health | ALT, AST, GGT, alkaline phosphatase, bilirubin | Hepatic injury, bile flow and metabolic strain | Abnormalities have many potential causes |
| Protein and nutrition status | Albumin, total protein, weight trend, dietary intake | Illness burden, protein-energy risk and recovery status | Albumin is strongly affected by inflammation |
| Hematologic aging | Hemoglobin, MCV, RDW, white cells, lymphocyte percentage | Anemia, marrow stress and systemic health | Requires investigation of underlying causes |
| Musculoskeletal function | Grip strength, chair stands, gait speed, lean mass | Sarcopenia, frailty and physical reserve | Technique and population cutoffs vary |
| Biological age | Epigenetic clocks, phenotypic age, proteomic age | Composite statistical aging pattern | Limited individual clinical actionability |
| Digital function | Resting heart rate, heart-rate recovery, sleep regularity, step patterns | Continuous change in activity and resilience | Device accuracy and behavior affect results |
Research frameworks increasingly treat biomarkers of aging as context-dependent tools. A marker suitable for risk prediction may not be suitable for measuring treatment response, and a marker that accurately estimates chronological age may not reveal whether an intervention has improved health.
The Geronutrition Longevity Biomarker Framework
An isolated number invites overinterpretation. A structured framework forces the result into context.
Geronutrition uses five questions: Signal, Context, Direction, Function and Action.
1. Signal: What Does the Biomarker Actually Measure?
Begin with the biology.
HbA1c estimates average glycemic exposure. Albumin is a liver-produced protein affected by inflammation, illness, fluid balance, liver function, kidney loss and nutritional status. Homocysteine is an amino acid influenced by folate, vitamin B12, vitamin B6, kidney function, genetics and medication use.
A biomarker should not be given a meaning it does not possess.
2. Context: What Could Be Altering the Result?
Interpret the result alongside:
- Acute illness
- Recent injury
- Hydration
- Exercise
- Fasting status
- Medication changes
- Supplement use
- Kidney function
- Liver function
- Anemia
- Body composition
- Laboratory method
An elevated inflammatory marker during an infection is not automatically evidence of chronic “inflammaging.”
3. Direction: Is the Marker Stable, Improving or Worsening?
Whenever possible, compare the result with previous measurements obtained under similar conditions.
A trend becomes more persuasive when it is:
- Repeated
- Measured consistently
- Moving in the same direction
- Supported by related markers
- Accompanied by symptoms or functional change
4. Function: Does the Laboratory Pattern Match Real-World Capacity?
Aging should not be reduced to blood chemistry.
Ask whether the person can:
- Walk at a usual pace
- Rise from a chair without using the arms
- Carry ordinary household items
- Recover after exertion
- Maintain balance
- Prepare food
- Perform daily activities
- Preserve independence
A molecular age score that improves while strength and mobility decline should not be treated as evidence of successful aging.
5. Action: Will This Result Change a Decision?
Before ordering a test, define the possible next step.
Will the result lead to:
- Further medical investigation?
- Dietary modification?
- Medication review?
- Supervised exercise?
- Treatment of deficiency?
- Repeat measurement?
- Referral to a specialist?
- No action?
A test without an interpretation pathway may create anxiety without improving health.
Vitamin D After 60: A Bone, Muscle and Nutritional Biomarker
Vitamin D occupies an unusual position in longevity discussions. It is relevant to bone mineral metabolism and muscle health, yet observational associations have often been interpreted more aggressively than clinical trials justify.
The standard blood marker is serum 25-hydroxyvitamin D, written as 25(OH)D.
What Vitamin D Testing Can Reveal
A 25(OH)D test may help assess vitamin D status when there is a clinical reason to suspect deficiency or altered vitamin D metabolism.
Relevant circumstances may include:
- Osteoporosis or low bone density
- Recurrent falls
- Malabsorption
- Bariatric surgery
- Limited sunlight exposure
- Certain liver or kidney conditions
- Use of medications affecting vitamin D metabolism
- Hypocalcemia
- Symptoms or conditions judged relevant by a clinician
Why “Optimal” Is Not a Universal Number
The 2024 Endocrine Society guideline concluded that outcome-specific 25(OH)D thresholds have not been established for generally healthy adults. It suggested against routine vitamin D testing in healthy adults, including generally healthy adults over 75, while supporting age-appropriate intake and daily lower-dose supplementation in selected older populations rather than intermittent high-dose strategies.
This distinction is important.
A laboratory reference range, a deficiency threshold, a treatment threshold and a supposed longevity optimum are not interchangeable concepts.
The practical guide to optimal vitamin D levels after 60 examines testing indications, supplementation patterns and the difference between correcting deficiency and chasing an unsupported high serum target.
Vitamin D Interpretation Framework
| Finding | Possible Interpretation | Appropriate Next Question |
|---|---|---|
| Low 25(OH)D with low intake | Inadequate dietary or supplemental intake | Is intake sufficient and consistent? |
| Low 25(OH)D with digestive disease | Possible malabsorption | Is gastrointestinal evaluation needed? |
| Low 25(OH)D with kidney disease | Altered vitamin D metabolism | Which vitamin D measurement or treatment is appropriate? |
| Persistent low level despite supplementation | Adherence, absorption, dose, obesity or medical factors | Is the regimen and diagnosis correct? |
| High level after supplementation | Possible excessive intake | Should supplementation be reduced or stopped? |
| Normal level with ongoing weakness | Vitamin D may not explain the symptom | Are muscle, thyroid, anemia or neurological factors present? |
Vitamin D should be treated as one component of musculoskeletal and nutritional assessment, not as a standalone longevity score.
Homocysteine and Aging: A Nutrient-Sensitive Cardiovascular Signal
Homocysteine is an amino acid formed during methionine metabolism. The body normally processes it through pathways that depend partly on folate, vitamin B12 and vitamin B6.
When homocysteine rises, the result may reflect one or more of the following:
- Folate deficiency
- Vitamin B12 deficiency
- Vitamin B6 insufficiency
- Reduced kidney function
- Hypothyroidism
- Genetic variation
- Smoking
- Certain medications
- Dietary patterns
- Increasing age
MedlinePlus notes that vitamin B12, vitamin B6 and folate participate in homocysteine metabolism, which is why an elevated result often prompts assessment of these nutrients.
Why Homocysteine Is Relevant to Longevity
Elevated homocysteine has been associated with cardiovascular, cognitive and neurological outcomes. Association, however, does not mean that lowering homocysteine with supplements will automatically prevent every associated outcome.
The biomarker is most useful when it helps uncover a correctable cause.
A person with elevated homocysteine and low vitamin B12 requires a different response from a person with elevated homocysteine, normal nutrient markers and impaired renal function.
Homocysteine Decision Tree
| Homocysteine Pattern | Related Measurements | Interpretation Direction |
|---|---|---|
| Elevated with low B12 | B12, methylmalonic acid, CBC | Investigate B12 deficiency |
| Elevated with low folate | Folate, dietary history, CBC | Investigate folate insufficiency |
| Elevated with reduced eGFR | Creatinine, cystatin C, urine testing | Consider renal contribution |
| Elevated with macrocytosis | MCV, B12, folate, thyroid testing | Investigate hematologic and endocrine causes |
| Elevated despite supplementation | Adherence, dose, diagnosis, renal function | Reassess cause rather than escalating blindly |
| Mild isolated elevation | Repeat test and full clinical context | Avoid treating the number alone |
The dedicated guide to homocysteine and aging explores nutrient interactions, testing strategy and the limits of homocysteine-lowering interventions.
CRP and Chronic Inflammation: Measuring Inflammatory Burden
C-reactive protein is produced primarily by the liver in response to inflammatory signaling.
Standard CRP is commonly used when clinicians are evaluating active inflammation, infection or inflammatory disease. High-sensitivity CRP, or hs-CRP, can measure lower concentrations and is used in cardiovascular risk assessment when the individual is clinically stable.
Why CRP Is a Longevity Biomarker
Persistent low-grade inflammation is associated with several age-related conditions. CRP can therefore act as a broad signal that the inflammatory environment deserves attention.
It cannot identify the cause by itself.
Elevated CRP may reflect:
- Infection
- Autoimmune activity
- Obesity
- Smoking
- Tissue injury
- Periodontal disease
- Poorly controlled metabolic disease
- Chronic inflammatory illness
- Recent surgery
- Strenuous exercise
- Acute stress on the body
Common hs-CRP Cardiovascular Interpretation
| hs-CRP Result | Traditional Cardiovascular Risk Category | Interpretation Caution |
|---|---|---|
| Below 1 mg/L | Lower relative inflammatory risk | Does not rule out other cardiovascular risks |
| 1–3 mg/L | Intermediate relative risk | Interpret with lipids, blood pressure and history |
| Above 3 mg/L | Higher relative risk | Investigate persistent causes and repeat when appropriate |
| Above 10 mg/L | Acute inflammation may be present | Repeat when clinically stable |
Traditional three-tier hs-CRP categories have used values below 1, from 1 to 3 and above 3 mg/L. More recent cardiovascular frameworks may also use hs-CRP at or above 2 mg/L as a risk-enhancing or residual-inflammatory-risk threshold. Results above 10 mg/L should generally be repeated when the person is stable because acute inflammation may be distorting the cardiovascular interpretation.
The Value of Repeated CRP Measurement
CRP is especially vulnerable to temporary distortion.
A useful chronic-inflammation assessment may require:
- Testing when the person is not acutely ill.
- Reviewing recent exercise, injury and infection.
- Repeating an unexpected elevation.
- Comparing the result with weight, waist circumference, glucose, lipids and symptoms.
- Investigating persistent elevation rather than suppressing the number with unproven supplements.
The complete guide to CRP and chronic inflammation explains the differences between CRP and hs-CRP, why repeat testing matters and how inflammatory results should be placed within cardiovascular and metabolic context.
Albumin Levels and Malnutrition: A Marker of Resilience, Not Just Protein Intake
Albumin is a protein produced by the liver. It contributes to fluid balance and transports hormones, fatty acids, medications and other substances through the blood.
Low albumin is frequently described as a marker of poor nutrition. That description is incomplete.
Albumin can be affected by:
- Inflammation
- Acute illness
- Liver disease
- Kidney protein loss
- Gastrointestinal protein loss
- Fluid overload
- Severe burns
- Cancer
- Reduced intake
- Frailty
- Protein-energy malnutrition
Research in older populations has consistently shown that albumin is associated with health outcomes, but it should not be used as an isolated diagnosis of malnutrition because illness and inflammation can alter the concentration independently of food intake.
Why Albumin Matters in Aging
Albumin can function as a broad marker of physiological reserve.
A gradual decline may accompany:
- Reduced appetite
- Unintentional weight loss
- Chronic inflammatory burden
- Deteriorating liver function
- Kidney disease
- Increasing frailty
- Repeated hospitalizations
- Difficulty recovering from illness
The marker becomes more informative when combined with weight history, dietary assessment, muscle function, CRP, liver markers, kidney markers and a validated nutrition screening tool.
Albumin Interpretation Matrix
| Albumin Finding | CRP or Inflammatory Context | Possible Direction |
|---|---|---|
| Low albumin with high CRP | Active inflammation may be suppressing albumin | Address illness and reassess |
| Low albumin with weight loss and low intake | Nutrition risk may be substantial | Complete nutrition assessment |
| Low albumin with protein in urine | Kidney loss may contribute | Renal evaluation |
| Low albumin with abnormal liver markers | Reduced synthesis may contribute | Liver assessment |
| Low albumin with edema | Fluid balance and systemic illness require evaluation | Medical assessment |
| Stable albumin with muscle loss | Albumin does not exclude sarcopenia | Measure strength and lean mass |
A deeper review of albumin levels and malnutrition explains why albumin should be interpreted as part of a nutrition–inflammation–organ function pattern.
HbA1c and Aging Metabolism: Tracking Long-Term Glycemic Exposure
HbA1c estimates the proportion of hemoglobin that has become glycated through exposure to glucose. It generally reflects average glycemic exposure over approximately two to three months, with greater influence from more recent weeks.
Why HbA1c Matters for Healthy Aging
Persistently elevated glucose can affect:
- Blood vessels
- Nerves
- Kidneys
- Eyes
- Cognitive health
- Wound healing
- Infection risk
- Muscle quality
- Cardiovascular risk
HbA1c therefore provides more than a diabetes classification. It helps reveal the metabolic environment in which the nervous, vascular and musculoskeletal systems are aging.
HbA1c Is Not Perfect
HbA1c interpretation can be altered by conditions affecting red blood cell production or lifespan, including:
- Iron deficiency
- Vitamin B12 or folate deficiency
- Hemolysis
- Blood loss
- Recent transfusion
- Hemoglobin variants
- Advanced kidney disease
- Certain anemias
An unexpected result may require confirmation through fasting glucose, oral glucose tolerance testing, continuous glucose monitoring or another method selected by a clinician.
Older Adults Need Individualized Targets
For older adults with diabetes, the lowest achievable HbA1c is not always the safest target.
The 2026 American Diabetes Association framework identifies a typical HbA1c goal of below approximately 7.0–7.5% for many otherwise healthy older adults. A less stringent goal, often below 8.0%, may be appropriate for people with greater medical complexity, functional limitations or higher treatment risk. Goals for people with very complex health conditions may focus more on avoiding symptomatic hyperglycemia and hypoglycemia than on a single HbA1c number.
This is a crucial longevity principle: a biomarker target should support health and independence, not create treatment-related harm.
The guide to HbA1c and aging metabolism examines age-related glucose changes, individualized targets and the relationship between glycemic control, muscle and cardiovascular health.
Muscle Mass Aging Biomarkers: Measuring Strength, Quantity and Performance
Muscle is not merely a movement tissue. It supports glucose disposal, balance, bone loading, recovery from illness, physical independence and metabolic reserve.
Muscle loss can begin before it becomes visually obvious. Body weight may remain stable because lost lean tissue is replaced by fat mass.
The Three Dimensions of Muscle Aging
A robust assessment evaluates three separate dimensions.
Muscle strength: Usually assessed through handgrip strength or chair-rise performance.
Muscle quantity or quality: Assessed through methods such as dual-energy X-ray absorptiometry, bioelectrical impedance, computed tomography or magnetic resonance imaging.
Physical performance: Assessed through walking speed, the Short Physical Performance Battery, timed up-and-go testing or related measures.
The revised European consensus on sarcopenia places low muscle strength at the center of case finding, uses low muscle quantity or quality to confirm sarcopenia and uses poor physical performance to identify greater severity.
Why Strength May Matter More Than Size Alone
A person can have a seemingly acceptable amount of muscle but poor neuromuscular function. Another person can have low muscle mass while retaining relatively good performance.
Muscle quantity, strength and performance should therefore not be treated as interchangeable.
| Muscle Domain | Accessible Measurement | What a Decline May Indicate |
|---|---|---|
| Upper-body strength | Handgrip dynamometry | Probable weakness or reduced reserve |
| Lower-body strength | Five-times chair stand | Difficulty producing functional force |
| Muscle quantity | DXA or validated bioimpedance | Reduced appendicular lean mass |
| Walking performance | Usual gait speed | Mobility and functional decline |
| Integrated function | Short Physical Performance Battery | Combined balance, walking and chair-rise limitations |
| Daily-life signal | Falls, stair difficulty, rising from chairs | Real-world loss of independence |
Blood Markers Associated With Muscle Decline
No routine blood test diagnoses sarcopenia by itself. Several laboratory measurements may reveal contributors or associated conditions:
- Vitamin D
- Albumin
- Creatinine
- Cystatin C
- CRP
- Hemoglobin
- Testosterone when clinically appropriate
- Thyroid markers
- Vitamin B12
- Glucose and HbA1c
- Kidney and liver function markers
The most clinically meaningful muscle mass aging biomarkers combine functional testing with body composition and targeted laboratory investigation.
Biological Age vs Chronological Age: What Is the Difference?
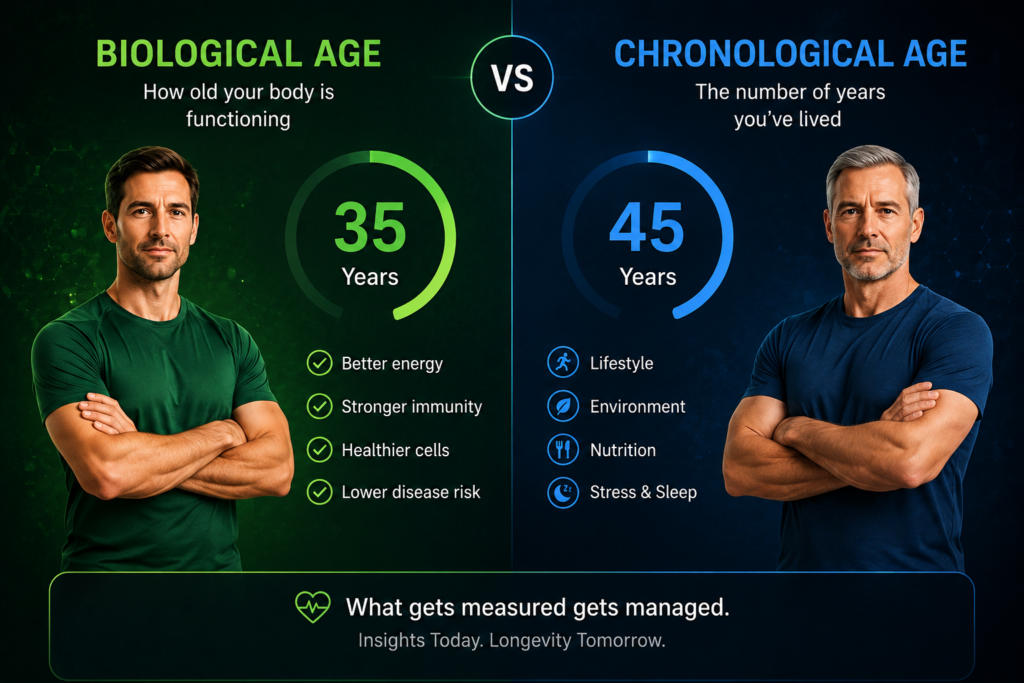
Chronological age counts the time since birth.
Biological age attempts to estimate the condition or aging pattern of the body using measurable characteristics.
Two people can both be 65 years old while differing greatly in blood pressure, glucose regulation, muscle strength, inflammation, organ function and physical resilience. Biological age models attempt to summarize some of these differences.
What Is a Biological Age Test?
A biological age test applies an algorithm to one or more types of data.
| Test Type | Data Used | Main Strength | Main Limitation |
|---|---|---|---|
| Clinical blood age | Routine laboratory markers | Accessible and relatively affordable | Sensitive to temporary illness and model design |
| Phenotypic age | Clinical markers associated with mortality risk | Connects routine data to health outcomes | Population model, not a personal diagnosis |
| Epigenetic age | DNA methylation patterns | Strong research value and broad molecular coverage | Cost, platform variation and limited clinical actionability |
| Proteomic age | Patterns of circulating proteins | May reveal organ-specific aging | Specialized testing and ongoing validation |
| Glycomic age | Immunoglobulin glycosylation patterns | Reflects aspects of immune and inflammatory aging | Limited availability |
| Digital age | Wearable and functional data | Continuous and noninvasive | Device and behavior dependent |
| Composite multi-omics age | Genomic, epigenomic, proteomic and metabolic data | Multisystem depth | Expense and difficult interpretation |
Biological Age Is a Model, Not a Direct Measurement
A thermometer directly measures temperature. Biological age does not directly measure “age” in the same sense.
It estimates age-related patterns using statistical relationships.
A result of “58 biological years” does not mean every organ is equivalent to that of an average 58-year-old. Different models may produce different ages because they were trained on different populations, markers and outcomes.
One model may optimize prediction of chronological age. Another may predict mortality. Another may focus on disease burden or pace of aging.
Can Biological Age Change?
Some biological age measurements change during periods of stress and recovery. NIA-funded research has reported that certain measures of biological age increased during major physiological stress and later declined after the stress resolved. This suggests that at least some aging measurements capture dynamic physiological state rather than permanent accumulated damage alone.
That responsiveness is promising, but it creates an interpretation problem: a changing score may reflect meaningful improvement, temporary recovery, laboratory variation or the mechanics of the algorithm.
Is a Biological Age Test Worth It?
A test is more likely to be useful when:
- The methodology is transparent.
- The test has been validated in independent populations.
- The same platform can be repeated.
- Individual component results are available.
- The result is interpreted alongside conventional medical markers.
- The person understands that it is a risk estimate, not a diagnosis.
- The result will not replace necessary medical care.
The guide to biological age testing examines epigenetic clocks, phenotypic age, commercial testing and the difference between research validity and personal utility.
What Blood Tests Predict Longevity?
No single blood test can reliably predict an individual’s lifespan.
Some measurements are associated with survival, disease burden, frailty or biological age in large populations. Their value lies in identifying modifiable risk and declining physiological reserve, not producing a countdown.
Core Longevity Blood Panel
A practical first-line panel may include measurements already used in conventional preventive care.
| Test or Panel | Longevity-Relevant Information |
|---|---|
| Complete blood count | Anemia, immune-cell patterns, MCV, RDW and hematologic change |
| Comprehensive metabolic panel | Glucose, albumin, electrolytes, liver enzymes and renal indicators |
| HbA1c | Longer-term glycemic exposure |
| Lipid panel | LDL-C, HDL-C, triglycerides and non-HDL cholesterol |
| ApoB where appropriate | Number of atherogenic lipoprotein particles |
| Creatinine and eGFR | Estimated kidney filtration |
| Urine albumin-to-creatinine ratio | Kidney and vascular injury |
| Blood pressure | Vascular load and cardiovascular risk |
| hs-CRP when clinically appropriate | Low-grade inflammatory risk |
| Vitamin B12 and folate when indicated | Nutrient-related hematologic and neurological risk |
| Iron studies when indicated | Iron deficiency, storage and transport |
| TSH when indicated | Thyroid contribution to metabolic and functional symptoms |
Extended Longevity Markers
Extended testing may be appropriate when the medical history or initial results justify it.
| Extended Marker | Potential Use |
|---|---|
| Homocysteine | Nutrient-sensitive metabolic and cardiovascular context |
| Cystatin C | Kidney filtration estimate less dependent on muscle mass |
| Lipoprotein(a) | Largely inherited cardiovascular risk |
| Vitamin D | Bone and mineral assessment in appropriate clinical contexts |
| Fasting insulin | Selected assessment of insulin resistance |
| GGT | Liver, alcohol and metabolic context |
| Ferritin with transferrin saturation | Iron status and inflammatory interpretation |
| Magnesium | Selected deficiency or medication-related assessment |
| Methylmalonic acid | Functional B12 assessment in uncertain cases |
| NT-proBNP | Cardiac strain in clinically appropriate settings |
Advanced and Experimental Measurements
| Advanced Test | Current Role |
|---|---|
| DNA methylation age | Aging research and commercial biological age estimation |
| Proteomic age | Research into systemic and organ-specific aging |
| Metabolomic age | Research into metabolic aging signatures |
| Immune age | Investigation of immune-system remodeling |
| Telomere length | Research marker with substantial individual variability |
| Cytokine panels | Specialized inflammatory research or clinical indications |
| Multi-omics aging score | Research and high-cost precision-health programs |
Blood-based age models can predict health outcomes in population datasets, and newer models may outperform older phenotypic-age calculations in particular cohorts. External validation and standardization remain necessary before these tools can function as definitive clinical measurements.
The detailed longevity blood markers guide explains how to build a medically sensible panel without ordering every available test.
How to Interpret Longevity Blood Markers Without Chasing “Optimal” Numbers
The word “optimal” is often used as though it describes a single scientifically established target. In practice, several different concepts may be confused.
Reference Interval
A reference interval describes values observed in a defined reference population. It does not necessarily represent the level associated with the lowest long-term risk.
Diagnostic Threshold
A diagnostic threshold helps classify a condition, often after confirmation or consideration of additional evidence.
Treatment Target
A treatment target is selected to reduce risk or manage disease. It may vary according to age, comorbidities, treatment side effects and personal circumstances.
Risk-Enhancing Threshold
A risk-enhancing threshold does not diagnose disease. It may strengthen the case for preventive action when considered with other risk factors.
Personal Baseline
A personal baseline is the individual’s own stable pattern measured under reasonably consistent conditions.
Longevity Target
A longevity target is often proposed by commercial clinics, commentators or observational studies. It may be useful as a hypothesis, but it should not automatically be treated as a clinical standard.
| Interpretation Layer | Question |
|---|---|
| Laboratory reference | Is the result outside the laboratory’s expected interval? |
| Clinical diagnosis | Does it meet criteria for a defined condition? |
| Risk assessment | Does it increase estimated future risk? |
| Trend assessment | Is it moving in an unfavorable direction? |
| Functional assessment | Does it correspond with symptoms or reduced capacity? |
| Intervention assessment | Can a safe, evidence-based action improve it? |
The Pattern Matters More Than the Isolated Number
Consider three examples.
Pattern one: HbA1c rises, triglycerides rise, waist circumference increases and blood pressure worsens. The combined pattern suggests deteriorating metabolic health more strongly than any one result alone.
Pattern two: Albumin falls, CRP rises, appetite declines and walking speed slows after hospitalization. The pattern suggests systemic illness and recovery risk rather than a simple need for protein powder.
Pattern three: Homocysteine rises, MCV increases and vitamin B12 becomes borderline. The pattern creates a stronger case for B12 investigation than homocysteine alone.
Look for Concordance
Confidence increases when multiple independent signals point in the same direction.
A biological age score indicating accelerated aging is more concerning when accompanied by:
- Declining grip strength
- Rising HbA1c
- Persistent hs-CRP elevation
- Worsening kidney function
- Higher blood pressure
- Reduced activity
- Unintentional weight change
When the advanced score conflicts with stable conventional markers and preserved function, the first step is usually to examine the model and repeatability rather than assume rapid aging.
How Often Should Longevity Biomarkers Be Tested?
Testing frequency should follow clinical need, not anxiety.
Repeated measurement is valuable only when enough time has passed for a meaningful change to occur and the result can influence an action.
| Situation | Possible Testing Approach | Important Qualification |
|---|---|---|
| Healthy adult with stable results | Routine preventive schedule | Frequency depends on age and risk |
| Newly abnormal result | Confirm according to clinical guidance | Rule out temporary distortion |
| Diet or treatment change | Retest after an appropriate response interval | Different markers change at different speeds |
| Deficiency treatment | Follow clinician-directed monitoring | Avoid unnecessary high-frequency testing |
| Diabetes | HbA1c commonly two to four times annually depending on control | Individual plan may differ |
| Acute illness | Delay elective longevity testing when possible | Acute inflammation can distort results |
| Biological age test | Repeat only on the same validated platform after a meaningful interval | Short-term movement may be noise |
| Muscle function | Periodic standardized retesting | Use the same device and technique |
A Four-Stage Testing Cycle
Baseline: Obtain the minimum set of measurements needed to answer a defined question.
Confirmation: Repeat unexpected or potentially temporary abnormalities where medically appropriate.
Intervention: Apply the relevant treatment, nutrition, activity or medication strategy.
Reassessment: Retest after enough time has passed to detect a biologically meaningful response.
Standardize Conditions
For better comparisons:
- Use the same laboratory when possible.
- Follow fasting instructions consistently.
- Record acute illness and recent strenuous exercise.
- Test at a similar time of day for markers affected by daily rhythm.
- Record medication and supplement changes.
- Use the same grip-strength device and body-composition method.
- Avoid comparing values produced by incompatible biological age platforms.
Longevity Biomarker Comparison Chart: Clinical Utility vs Novelty
The following editorial chart ranks broad marker categories by present-day actionability, repeatability and research maturity. It is not a medical scoring system.
Relative Utility Chart
Routine cardiometabolic markers   █████  High clinical utility
Kidney and liver function         █████  High clinical utility
CBC and nutrient assessment       ████▌  High when appropriately indicated
Grip strength and gait speed      ████▌  High functional relevance
hs-CRP and homocysteine           ███▌   Context-dependent utility
Clinical biological age models    ███    Emerging complementary utility
Epigenetic aging clocks           ██▌    Strong research interest
Proteomic and organ-age models    ██     Rapidly developing
Multi-omics longevity panels      █▌     Experimental and costly
Single telomere-length testing    █      Limited individual interpretation
Decision Comparison
| Biomarker Type | Medical Actionability | Repeatability | Cost | Best Use |
|---|---|---|---|---|
| HbA1c, lipids, blood pressure | High | High | Low to moderate | Disease prevention and management |
| CBC, kidney and liver panels | High | High | Low to moderate | Detecting organ and hematologic change |
| Vitamin and mineral markers | Moderate to high when indicated | Moderate | Moderate | Confirming suspected deficiency |
| Grip strength and gait speed | High | High with standardization | Low | Functional aging and sarcopenia |
| hs-CRP | Moderate | Moderate | Low | Inflammatory and cardiovascular context |
| Homocysteine | Moderate | Moderate | Moderate | Nutrient and metabolic investigation |
| Phenotypic age | Moderate | Moderate | Low to moderate | Composite trend analysis |
| Epigenetic age | Emerging | Platform dependent | Moderate to high | Research and longitudinal tracking |
| Proteomic organ age | Emerging | Still developing | High | Research and specialized assessment |
| Telomere length | Low for individual decisions | Variable | Moderate | Research rather than standalone guidance |
Functional measures remain especially important. Recent geroscience commentary has cautioned that molecular excitement should not displace measurements of strength, resilience, frailty and performance that already have established relationships with morbidity and mortality.
Common Longevity Biomarker Testing Mistakes
Mistake 1: Treating a Reference Range as an Ideal Range
A value inside the reference interval may still deserve attention when it is changing rapidly or conflicts with symptoms.
Conversely, a slightly out-of-range result may reflect expected variation, measurement conditions or a non-dangerous individual difference.
Mistake 2: Ordering Advanced Tests Before Basic Evaluation
A $500 epigenetic clock cannot replace blood pressure measurement, a complete blood count, kidney assessment, glucose testing or a review of muscle function.
Advanced tests should add information, not distract from established risk factors.
Mistake 3: Testing During Acute Illness
Inflammation, dehydration, infection, surgery and strenuous activity can alter CRP, albumin, glucose, white blood cells, liver enzymes and several other markers.
Testing during physiological disruption may be medically necessary, but it should not automatically be treated as a stable longevity baseline.
Mistake 4: Reacting to One Result
A single abnormal result should often be confirmed or investigated before aggressive intervention.
This is particularly important for nonspecific markers such as CRP and for measurements that are sensitive to hydration, fasting, exercise or assay method.
Mistake 5: Correcting the Marker Without Correcting the Cause
Taking folic acid may lower homocysteine, but it may also obscure an untreated vitamin B12 problem if the underlying cause is not investigated properly.
Increasing protein intake may not normalize albumin when inflammation, liver disease or kidney protein loss is driving the reduction.
Mistake 6: Ignoring Medication Risk
A lower HbA1c may look favorable while the treatment used to achieve it is causing recurrent hypoglycemia, falls or confusion.
Longevity care must consider whether the route to the target is safe.
Mistake 7: Measuring Muscle Mass Without Muscle Function
A body-composition device may estimate lean mass, but it does not show whether the person can generate force, walk efficiently or recover balance.
Strength and physical performance belong in the assessment.
Mistake 8: Comparing Incompatible Biological Age Tests
Two biological age platforms can produce different results because they measure different biological layers and use different algorithms.
The scores should not be treated as interchangeable.
Mistake 9: Testing Too Frequently
Frequent testing increases the chance of detecting random variation and may encourage unnecessary intervention.
The interval should reflect the biology of the marker and the expected timing of change.
Mistake 10: Allowing the Score to Replace the Person
The strongest longevity outcome is not a lower algorithmic age. It is preserved cognition, mobility, independence, metabolic control, recovery capacity and quality of life.
Upcoming Trends and Latest Research in Longevity Biomarkers
The longevity field is moving away from the idea that one clock can summarize the entire body.
The emerging model is multidimensional: different organs, molecular systems and functional capacities may age at different rates.
1. Organ-Specific Biological Age
A person may show relatively preserved liver biology but accelerated vascular, renal, immune or neurological aging.
Proteomic research is increasingly examining whether patterns of circulating proteins can estimate the biological condition of individual organs. This may eventually improve early risk detection by identifying which system is aging faster rather than reducing the body to one age score.
2. Blood-Based Biochemistry Clocks
Routine blood markers remain attractive because they are accessible, comparatively affordable and already integrated into healthcare.
Recent research continues to produce biological age clocks based on small groups of commonly measured biomarkers. A newly published blood-biochemistry model, for example, uses 11 routine markers, while another recent clinical aging clock uses seven sex-adjusted biomarkers to estimate health risk. These models require independent validation before they can be treated as universal clinical tools.
3. Better Standards for Aging-Biomarker Trials
Research groups are developing recommendations for specimen collection, data handling, timing and outcome measurement in geroscience trials.
This work matters because a biomarker cannot become clinically trustworthy when every study collects samples differently, uses a different assay or defines successful aging differently.
Recent recommendations emphasize standardized data collection, transparent context of use and parallel validation of aging measures across interventions.
4. Dynamic Resilience Testing
A static result measures the body at rest. Resilience testing examines how the body responds to and recovers from a controlled challenge.
Future assessments may place greater emphasis on:
- Glucose response after meals
- Heart-rate recovery after exercise
- Recovery after sleep disruption
- Immune response to vaccination
- Physiological recovery after surgery
- Response to standardized physical tasks
This approach may reveal declining reserve before resting measurements become clearly abnormal.
5. Digital Biomarkers of Aging
Wearables can collect repeated information about:
- Walking speed
- Step regularity
- Sleep timing
- Resting heart rate
- Heart-rate variability
- Activity fragmentation
- Recovery from exertion
- Changes in daily routine
A 2025 review identified digital biomarkers as a growing method for monitoring physiological systems in community-dwelling adults. Continuous measurement may detect behavioral and functional shifts that occasional clinic visits miss, although device quality, adherence and interpretation remain significant limitations.
6. Immune-Age and Inflammation Clocks
Immune aging does not consist only of “high inflammation.” It includes changes in immune-cell composition, signaling, response quality and the balance between immune activation and immune competence.
Future panels may integrate cell populations, inflammatory proteins, antibody glycosylation and response to immune challenges.
7. Multi-Omics Integration
Multi-omics models combine several biological layers:
- Genomics
- Epigenomics
- Transcriptomics
- Proteomics
- Metabolomics
- Glycomics
- Microbiome data
The goal is to detect patterns that are invisible to any one layer.
The difficulty is interpretation. The more variables a model contains, the greater the risk that it becomes technically impressive but clinically opaque.
8. Nutrition-Responsive Aging Markers
Researchers are increasingly interested in identifying biomarkers that respond reliably to dietary patterns, protein intake, energy balance, metabolic health and microbiome-accessible nutrients.
The key question is not merely whether a marker changes after an intervention. It is whether that change predicts a meaningful improvement in health, resilience or disease risk.
Small pilot studies may produce encouraging biological age changes, but they cannot establish that the intervention extends lifespan. Larger controlled trials and longer follow-up remain essential.
9. Stronger Validation of Commercial Tests
The commercial biological age market is growing faster than clinical consensus.
Future quality standards will likely focus on:
- Independent validation
- Reproducibility
- Population diversity
- Transparent algorithms
- Clearly defined intended use
- Sensitivity to meaningful change
- Comparison with established clinical outcomes
- Protection of genetic and molecular data
An expert consensus published in 2025 identified a group of potential aging biomarkers for intervention studies, but the field continues to distinguish promising research endpoints from validated surrogate outcomes.
10. From Biological Age to Rate of Aging
A single biological age estimate is influenced by the starting point and the model.
Pace-of-aging approaches attempt to measure how quickly biological systems are changing over time.
This may eventually be more useful because it asks a longitudinal question:
Is the person’s physiology deteriorating faster or more slowly than expected?
The challenge is that reliable rate measurement requires standardized repeated data over a sufficient period.
Editorial Insights: Longevity Is a Trajectory, Not a Test Result
The strongest longevity strategy is not built around obtaining the most impressive panel. It is built around preserving the systems that allow a person to remain metabolically stable, physically capable and resilient during stress.
A sophisticated epigenetic report can be interesting. It becomes secondary when blood pressure is uncontrolled, glucose is rising, muscle strength is falling or nutrition is inadequate.
The hierarchy matters.
Routine laboratory markers identify disease and modifiable risk. Nutritional biomarkers reveal deficiencies and impaired intake. Functional measurements show whether the body can translate biological resources into movement and independence. Biological age models may then provide an additional statistical layer.
The most useful longevity record therefore contains both numbers and capabilities:
- HbA1c alongside walking performance
- Albumin alongside appetite and weight trend
- Vitamin D alongside bone and fall risk
- CRP alongside metabolic and inflammatory context
- Creatinine alongside muscle mass and cystatin C
- Biological age alongside strength, sleep and daily function
Aging research is moving toward the same conclusion: biological aging is multisystem, dynamic and context dependent. The future will belong to integrated measurements, but integration must not become complication for its own sake.
The purpose of biomarker testing is to improve decisions.
When the data reveal a correctable deficiency, emerging metabolic problem, inflammatory burden or loss of physical reserve, the test has created value. When the result produces only a dramatic score with no clear interpretation or action, it has created information without direction.
Geronutrition’s broader Longevity resources connect these measurements with nutrition, muscle preservation, metabolic health and evidence-based healthy aging strategies.
Longevity Biomarker FAQs
What Are the Best Longevity Biomarkers to Track?
The most useful longevity biomarkers are those linked to actionable health domains: blood pressure, HbA1c, ApoB or a conventional lipid profile, kidney function, urine albumin, complete blood count, muscle strength, walking performance and appropriately selected nutrient markers. No single biomarker can represent total biological aging.
How Often Should Longevity Biomarkers Be Tested?
Stable adults may follow routine preventive testing schedules. More frequent testing may be appropriate after a new abnormal result, treatment change, diagnosed deficiency or change in medical status. Testing should occur often enough to detect meaningful change, but not so frequently that normal biological variation drives unnecessary intervention.
What Is the Best Biological Age Test?
There is no universally best biological age test. Clinical blood-age models are accessible, epigenetic clocks provide molecular information and proteomic tests may reveal organ-specific patterns. The best choice depends on validation, transparency, repeatability and whether the result adds information beyond conventional health assessment.
Which Longevity Biomarkers Matter Most After 60?
After 60, priority markers generally include glycemic control, cardiovascular risk, kidney function, blood pressure, anemia, nutrient deficiencies, albumin, muscle strength, gait speed and unintentional weight change. Testing should be individualized according to symptoms, medications, medical history and functional status.
Are “Optimal” Longevity Blood Marker Ranges Better Than Normal Ranges?
Not automatically. A laboratory reference interval, disease threshold, treatment target and proposed longevity optimum serve different purposes. “Optimal” ranges should be supported by reliable outcome evidence and interpreted according to the individual’s age, conditions and treatment risks.
People Also Ask About Longevity Biomarkers
What Blood Tests Predict Longevity?
No blood test can predict an individual’s exact lifespan. Patterns involving glucose regulation, inflammation, kidney function, albumin, blood-cell characteristics, lipid burden and liver function are associated with health outcomes and may help identify modifiable risks.
Can a Blood Test Show Your Biological Age?
A blood test can estimate biological age by applying an algorithm to a combination of biomarkers. The result is a statistical comparison with population data, not a direct measurement of cellular age or a diagnosis.
What Is Biological Age vs Chronological Age?
Chronological age is the number of years since birth. Biological age estimates how closely a person’s physiological or molecular measurements resemble patterns associated with younger or older populations.
Is CRP a Longevity Biomarker?
CRP can contribute to longevity assessment because it reflects inflammatory activity and may improve cardiovascular risk evaluation. It is nonspecific, so an elevation must be interpreted in relation to infection, obesity, chronic disease, injury and other clinical factors.
Can Longevity Biomarkers Tell How Long You Will Live?
Longevity biomarkers cannot determine an exact lifespan. They can identify health patterns associated with higher or lower risk and may reveal opportunities to improve metabolic health, cardiovascular risk, nutritional status, muscle function and physiological resilience.